Category: Uncategorized

  • Theming Power BI Organizational Custom Visuals

    I’ve recently created a Power BI Custom Visual for our BOQ report headers, as we have a specific header visual style that we want all reports to have:

    Normally when theming a custom visual that you import as a file, you just need to use the guid property of the custom visual (in pbiviz.json) as the key in the theme JSON file. For example, we use BOQGroupHeader in both pbiviz.json and theme.json:

    pbiviz.json

    {
        "visual": {
            "name": "BOQGroupHeader",
            "displayName": "BOQ Group Header",
            "guid": "BOQGroupHeader",
        }
    }

    theme.json

    {
        "visualStyles": {
            "BOQGroupHeader": {
              "*": {
                "background": [
                  {
                    "show": false
                  }
                ],
                "title": [
                  {
                    "show": false
                  }
                ]
              }
            }
        }
    }

    However, when users download the custom visual from Power BI Service as a Organisational Visual, the theme file does not work. This is because Microsoft must change the guid property of the visual to ensure it doesn’t collide with file imported visuals vs Organisational Visuals.

    If you open up the pbix file, you can find that Microsoft add a suffix of _OrgStore to the Organisational Visual, and this needs to be added to the theme file for the custom visual then to use that theme.

    So our new theme.json looks like:

    {
        "visualStyles": {
            "BOQGroupHeader_OrgStore": {
              "*": {
                "background": [
                  {
                    "show": false
                  }
                ],
                "title": [
                  {
                    "show": false
                  }
                ]
              }
            }
        }
    }
  • Trimming and fading out video/audio with ffmpeg

    I recently wanted to trim and fade out an MP4 file. I wasn’t inclined at the effort of putting it in a non-linear editor and was looking for a quick way to achieve this.

    I found that ffmpeg had the necessary functionality to do this. The command I used in the end was:

    ffmpeg -i in.mp4 -ss 00:00:00 -t 00:05:00 -vf "fade=t=out:st=297:d=3" -af "afade=t=out:st=297:d=3" out.mp4

    The commands are:

    • -i in.mp4 is the input file
    • -ss 00:00:00 is where the video should start from (set this to other than zero to trim the start)
    • -t 00:05:00 is the duration of the video, trimming any video after that
    • -vf "fade=t=out:st=297:d=3" is a video filter which fades out at 297 seconds (4:57) over a 3 second duration
    • -af "afade=t=out:st=297:d=3" is the corresponding audio filter which fades out at 297 seconds (4:57) over a 3 second duration
    • out.mp4 is the output file

    The video and audio filters have several more properties you can play with, such as if you want to fade to white using a log curve for the audio fade.

    You can also combine filter commands by separating them with a comma, if you want both a fade in and fade out, for example:

    -vf "fade=t=in:st=0:d=3,fade=t=out:st=297:d=3" -af "afade=t=out:st=0:d=3,afade=t=out:st=297:d=3"

  • Finding overlapping MIDI notes

    I’ve been using Beeano Midi Player to visualise MIDI tracks on a piano roll for inclusion in piano tutorial videos. As the software doesn’t support the sustain pedal for indicating the duration of a held note, I’ve been extending a note in the MIDI track to occupy the entire held duration, and at the same time, using quantisation. Beeano is a bit temperamental processing overly quantised MIDI tracks, where two held notes of the same pitch that are snug against each other are considered overlapping. Beeano plays the first note, but cuts out for the second overlapping note in the visualisation.

    MIDI doesn’t have the concept of a note duration; instead a held note is represented by a MIDI on event at a pitch and a MIDI off event at the same pitch to represent a held note. In addition to the MIDI off event, the MIDI spec also indicates that a zero velocity MIDI note on can also represent the end of a note.

    A prevention method for these overlapping notes is to not overly quantise notes such that note ends finish at the same time as the next note (at the same pitch) starts. However, if that is required, instead of checking each note, a quick remediation method is to select all notes in the track using a sequencer, and decrease the length a few ticks.

    I found this last step helped immensely with my tracks, but I was still finding the occasional overlapping note when running through Beeano. This could be due to the recording device, but I’m not sure.

    To detect these overlapping notes, I wrote a quick Python script that would report on these overlaps. This helps narrow the search down trememdously.

  • Diffing Analysis Service Tabular models

    One of the problems we often face when diffing Analysis Services Tabular models in a collaborative development environment is that tables, columns, and relationships can often be reordered. This is because Visual Studio caches data to disk, and when the Model.bim is reloaded, the order from disk is used, and any extra items are appended to the end of the item array.

    For example, if Alice loads Bob’s changes in Visual Studio, Alice’s cached data is used to determine the order, and then Bob’s changes are appended to the end of the array. So if Alice adds a single column, the diff will appear to contain all of Bob’s changes (reordering) as well as Alice’s changes.

    To help with providing more accurate diffs, we can sort the item arrays deterministically (i.e. by name). When used as a git post-commit hook, this will take care of any diffs done in code review.

    I created a tiny Node.js script to perform the reordering: Tabular Normalizer.

  • Data model impact analysis with Power BI

    Our current set up with Power BI is to host Analysis Services databases, and point a Power BI report to that. Due to the de-coupling of the data model and the report, there is no current mechanism to identify what fields and tables in Analysis Services are being used by which Power BI reports.

    I’ve written a PowerShell script that will help in understanding this relationship: https://github.com/avinmathew/extract-powerbi-fields

    Point the script to a directory containing Power BI .pbix or .pbit files, and the script will iterate through each of the reports, open up the Layout file, and extract all used fields to a CSV file with three columns: Field, Table, File.

    Due to the complexities of Layout structure with filters on visuals, I’ve taken a shortcut and used regex rather than JSON navigation to mop up any missing properties not found the the first two passes. This will result in the Table column in the CSV file being blank in these cases.

  • Using Leaflet in a Power BI Custom Visual

    For some of the spatial visualisations I’ve been working with in Power BI, I’ve had to create Custom Visuals as the out-of-the-box and visuals in the AppSource don’t quite hit the mark. I’m quite fond of Leaflet for map rendering. Here’s how I got it working with a Power BI Custom Visual.

    Create a new Custom Visual via the Command Line:

    pbiviz new LeafletCustomVisual
    

    In the newly created directory, install Leaflet via npm:

    npm install --save leaflet
    

    You need the geojson as the typings for Leaflet (in the next step), depends on the package being available.

    Install typings for Leaflet:

    npm install --save-dev @types/leaflet
    

    As Power BI Custom Visuals don’t currently support modules, you will need to grab the Leaflet object from the window. Create an inject.js file with the contents:

    var L = window.L;
    

    Add the Leaflet package and inject.js file to pbiviz.json in the externalJS key:

    "externalJS": [
    "node_modules/leaflet/dist/leaflet.js",
    "inject.js",
    "node_modules/powerbi-visuals-utils-dataviewutils/lib/index.js"
    ],
    

    Import the Leaflet stylesheet to style/visual.less :

    @import (less) "node_modules/leaflet/dist/leaflet.css";
    

    In src/visual.ts, change the constructor to:

    private map: L.Map;
    
    constructor(options: VisualConstructorOptions) {
    console.log('Visual constructor', options);
    this.target = options.element;
    // Fill the target element with the Leaflet map
    this.target.style.width = "100%";
    this.target.style.height = "100%";
    
    if (typeof document !== "undefined") {
    this.map = L.map(this.target).setView([0, 0], 2);
    L.tileLayer("https://{s}.tile.openstreetmap.org/{z}/{x}/{y}.png").addTo(this.map);
    }
    }
    

    You can find an example project on GitHub.

  • SecurePay SecureFrame example

    I recently had to debug an application that uses SecurePay as an online payment system. Rather than using API integration, the application used SecureFrame, where SecurePay provides the payment page (e.g. via an iframe). I couldn’t find an example in the SecureFrame documentation, so here’s a minimal working example:

    <!DOCTYPE html>
    <html>
    <head>
    <script src="https://cdnjs.cloudflare.com/ajax/libs/jquery/2.2.1/jquery.min.js"></script>
    <script src="https://cdnjs.cloudflare.com/ajax/libs/crypto-js/3.1.2/components/core-min.js"></script>
    <script src="https://cdnjs.cloudflare.com/ajax/libs/crypto-js/3.1.2/components/sha1-min.js"></script>
    <script src="https://cdnjs.cloudflare.com/ajax/libs/moment.js/2.11.2/moment.min.js"></script>
    <script>
    $(function() {
      var merchantId = "ABC0001";
      var password = "abc123";
      var txnType = "0";
      var primaryRef = "Test Reference";
      var amount = "100";
      var timestamp = moment.utc().format("YYYYMMDDHHMMSS");
      var fingerprint = CryptoJS.enc.Hex.stringify(
        CryptoJS.SHA1([merchantId, password, txnType, primaryRef, amount, timestamp].join("|"))
      );
      $('input[name="merchant_id"]').val(merchantId);
      $('input[name="txn_type"]').val(txnType);
      $('input[name="primary_ref"]').val(primaryRef);
      $('input[name="amount"]').val(amount);
      $('input[name="fp_timestamp"]').val(timestamp);
      $('input[name="fingerprint"]').val(fingerprint);
      $("form").submit();
    });
    </script>
    </head>
    <body>
    <form action="https://payment.securepay.com.au/test/v2/invoice" method="post">
      <input type="hidden" name="bill_name" value="transact">
      <input type="hidden" name="merchant_id">
      <input type="hidden" name="txn_type">
      <input type="hidden" name="primary_ref">
      <input type="hidden" name="amount">
      <input type="hidden" name="fp_timestamp">
      <input type="hidden" name="fingerprint">
    </form>
    </body>
    </html>
    

  • SOAP and REST

    I recently published an article on the MIMOSA website that discusses the virtues of SOAP and REST in the context of the information and interoperability standards that we support.

    Read the article

  • Financial Comparison of Air Conditioners

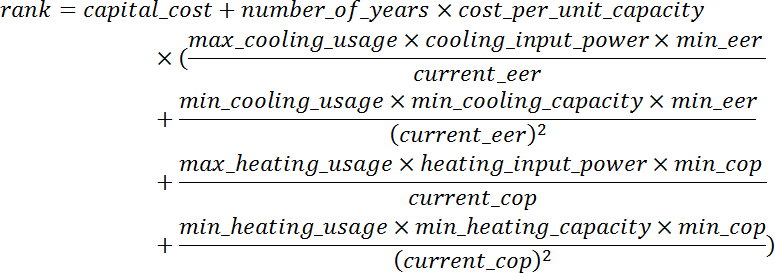
    I’ve been looking to get ducted AC installed at my residence and have had a few quotes come in. As the AC units, zoning and controls came with a similar set of features, I investigate the decision from an objective financial standpoint by ranking the offerings by comparing both the capital and operating costs. The rank* is calculated by:

    ac_equation

    where
    capital_cost is the total installation price in dollars
    number_of_years is the number of years the AC will be in operation
    cost_per_unit_capacity is the electricity price (e.g. cents per kWh)
    max_cooling_usage is the number of hours per year the AC will run on max cooling capacity
    min_cooling_usage is the number of hours per year the AC will run on min cooling capacity
    max_heating_usage is the number of hours per year the AC will run on max heating capacity
    min_heating_usage is the number of hours per year the AC will run on min heating capacity
    cooling_input_power is the rated input power in kW for cooling
    heating_input_power is the rated input power in kW for heating
    min_cooling_capacity is the minimum cooling capacity in kW
    min_cooling_capacity is the minimum heating capacity in kW
    min_eer is the min EER (Energy Efficiency Ratio) out of all the ACs being compared
    current_eer is the EER of this particular AC
    min_cop is the min COP (Coefficient Of Performance) out of all the ACs being compared
    current_cop is the COP of this particular AC

    I use the term rank rather than Total Cost of Ownership since I don’t bother discounting future cashflows nor take into account maintenance (since I couldn’t get a hold of spare parts price lists).

    Most spec sheets also don’t provide an input power at min capacity, so the calculation tries to make an estimate based on the EER/COP, input power and min capacity. For those that do provide an input power at min capacity, the 2nd and 4th components within the parentheses can be made similar to the 1st and 4th components.

    Ironically, I ended up choosing the AC ranked second, because of a qualitative aspect – the brand value that would have a bearing on price and availability of spare parts required outside the warranty period.